


DIAG images — diagnostic images — are purpose-built visuals that explain a system, answer a diagnostic question, or reveal what’s going wrong. Unlike decorative graphics, every element in a DIAG image serves the diagnosis: showing structure, flow, state, or causality so a viewer can understand and act.
The ability to process and present data in an easily understandable way has become a critical skill. This guide covers what DIAG images are, their anatomy, how they’ve evolved, where they’re used, and how to create them.
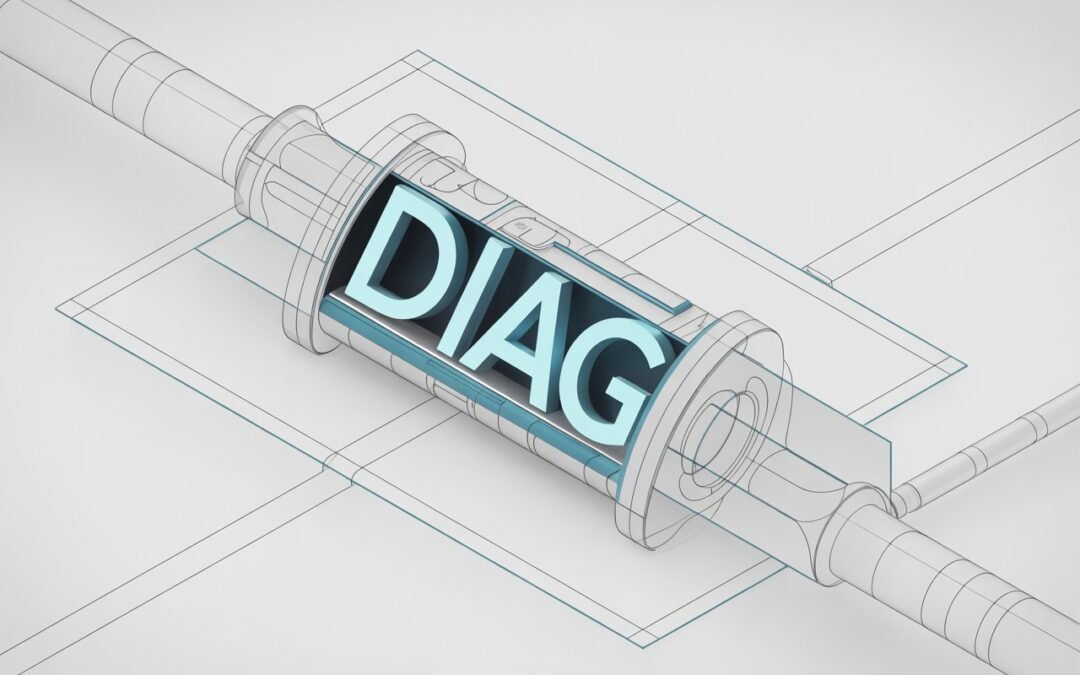
What Is a DIAG Image?
Simply put, any graphic made to reflect a process, answer a diagnostic question, or provide analytical clarity qualifies. A network topology diagram that helps an engineer find a failure point is a DIAG image. So is a medical illustration that shows a surgeon exactly where to operate, or a flowchart that reveals why customers abandon a checkout page.
DIAG images do three jobs:
- Analytical: Breaks a whole into parts to reveal relationships, dependencies, and failure points.
- Guiding: Directs the viewer’s eyes and mind toward a specific conclusion, decision, or action.
- Communicative: Creates shared understanding across a team — one diagram that aligns everyone on the same picture.
Unlike a general infographic that tells an overarching story, a DIAG image is usually built around a single diagnostic question: what’s happening, and why?
The Anatomy of an Effective DIAG Image
Creating a strong DIAG image is an intentional act of visual communication. The effective ones share these traits:
- Clarity of purpose: Each element must contribute to the diagnostic goal. Remove anything decorative.
- Hierarchical visual flow: The most crucial element — usually the core problem or system — gets the most visual weight.
- Integrated labeling: Keywords and labels are part of the design, not afterthoughts. Clear typography prevents misreading.
- Contextual symbols and conventions: Standard symbols, line styles (dashed for proposed, solid for actual), and color codes let experts read the image at speed.
- Balanced abstraction: A network DIAG image doesn’t need photorealistic servers — simplified icons communicate faster. But abstract too far and you lose meaning.
The Evolution: From Blueprint to Digital HUD
DIAG images have a rich history. They began as hand-drawn engineering blueprints and medical sketches — static, painstaking, authoritative.
The digital revolution changed everything. With CAD, data visualization tools, and real-time dashboards, the most sophisticated DIAG images today are living entities:
- Interactive dashboards: Each segment of a sales performance DIAG image can be clicked to reveal underlying data.
- Real-time system monitors: Network operation centers use large DIAG images where components change color as status changes.
- Augmented reality overlays: A technician wearing AR glasses can look at a machine and see a DIAG image projected onto it, highlighting the faulty part.
The static map has become an interactive cockpit — and the design principles behind effective visual symbols matter more than ever. For a related look at how simple geometric forms carry meaning, see our guide to the geometry arrow.
Cross-Industry Use: The Universal Diagnostic Tool
DIAG images are practical, cross-disciplinary, and serve as a universal language of clarity:
- Healthcare and medicine: Annotated scans, surgical planning diagrams, and patient-flow charts where clarity can save lives.
- Technology and software: System architecture diagrams, debugging flowcharts, and infrastructure maps — where most modern DIAG images are used.
- Engineering and manufacturing: Foundational documents for construction, assembly, and quality control.
- Education and research: Diagrams that make complex systems — from chemical processes to economic models — graspable.
Why Our Brains Love DIAG Images
Visuals are processed far faster than text. Strong DIAG images exploit three cognitive advantages:
- Offloading cognitive load: Externalizing a system into a diagram frees working memory for reasoning instead of remembering.
- Revealing patterns: Relationships, cycles, and outliers that hide in tables jump out in a visual layout.
- Facilitating shared understanding: One diagram aligns a whole team on the same mental model, diagnosing misalignment itself.
How to Create a Powerful DIAG Image
- Begin with the diagnosis. Define the primary question before drawing anything.
- Know your audience. A DIAG image for engineers can use density and jargon; one for executives or patients cannot.
- Use white space. Clutter is the enemy of diagnosis. Space organizes elements and guides the eye.
- Use color with purpose. Color should encode meaning — status, severity, category — not decorate.
- Iterate and test. The best DIAG images are refined drafts. Show them to someone unfamiliar and watch where they get confused.
Designers who want to see how professionals handle visual communication can browse portfolios on ArtStation, where thousands of designers share infographics, icon systems, and data visualization work.
Frequently Asked Questions
What is a DIAG image?
A diagnostic image — a purpose-built visual that explains a system, answers a diagnostic question, or reveals what’s going wrong. Examples include network diagrams, medical illustrations, and process flowcharts.
How is a DIAG image different from an infographic?
An infographic typically tells a broad story for a general audience. A DIAG image is built around a specific diagnostic question and is designed to support analysis and decision-making.
What tools create DIAG images?
Anywhere from whiteboards and diagramming tools (like Lucidchart or Miro) to CAD software, BI dashboards (Power BI, Tableau), and custom code (D3.js). The tool matters less than clarity of purpose.
Conclusion: The Indispensable Visual Compass
The DIAG image sits at the intersection of analytical depth and visual clarity. It turns invisible systems into something a team can point at, discuss, and fix. In a world drowning in data, the ability to make a single image that diagnoses correctly is a genuine superpower.
you may also read our guide to Xiangaijiaqi.com.